
Hello, I’m Adi!
Product Designer at Optimove (Previously -Playtika) with an MA in Neuroscience and more than 4 years of experience. I bridge the gap between cognitive science and UX, leveraging AI to build human-centered experiences.
New Installs by Groups


Control Group
Group A
Group B
Group C
0
50
100
150
200
Num. New Installs
113
New Installs Over Time
0
50
100
150
200
250
300
350
400

01.01
05.01
10.01
15.01
20.01
25.01
30.01
Retention


Control Group

Group A

Group B

Group C
07
dormant PU
dormant PU

3.45%

3.45%

Groups
Average

Lift
Number of Players
Absolute Change
group A VS. Control
29.75%
234,212
2.5%
1300
group B VS. Control
42.15% (40,222)
234,212
2.5%
1034
group C VS. Control
25.32% (45,323)
234,212
2.5%
734
06
cristian inapp september 8
+
45
-
14
06
new players
-
112
+
328


250%
200%
150%
100%
50%
10%
01.01
05.01
10.01
15.01
20.01
25.01
30.01


Retention
07.01

Group C
83%

Group B
65%

Control Group
56%

Group A
55%


Total New Installs (All groups)
20, 000


Lucy_Cards_2023
Stop
Finished

FL


aB testing


P
v 1.2.0
Summary
analysis
Summary
analysis
Date Range:
Last 7 Days

Group A vs. Control
Lift
Increase
CI Lift

Group B vs. Control
Lift
Increase
CI Lift
Group D vs. Control
Lift
Increase
CI Lift
Metrics
Metric

Gross Revenue
Goal Metric
Retention Day 1
Retention Day 7
Retention Day 14
Retention Day 30
Conversion Day 1
Conversion Day 7
Conversion Day 14
Conversion Day 30
ARPI Day 1
ARPI Day 7
ARPI Day 14
ARPI Day 30


+5.77%
+5.77%
-3.45%
+5.77%

+4.54%
-4.54%


-$1K
-$966
-1.74%
+4.54%
-$989.27
-263.11%
-263.11%
-263.11%
+2.33%


+16.08%
+16.08%
+16.08%
+23.32%
+2.23%
+$0.39
-$-0.0
+$0.1
-1.23%


+16.08%
+16.08%
+16.08%
+2.23%
-1.23%
+$0.39
-$-0.0
+$0.1
-1.67%


+16.08%
+16.08%
+16.08%
-1.23%
+12.5%
+$0.39
-$-0.0
+$0.1
+12.5%


-$1K
-$966
-1.74%
-1.74%
-$989.27
-263.11%
-263.11%
-263.11%
+4.54%


+16.08%
+16.08%
+16.08%
-1.74%
-1.74%
+$0.39
-$-0.0
+$0.1
+2.43%


+16.08%
+16.08%
+16.08%
-1.74%
+2.23%
+$0.39
-$-0.0
+$0.1
+5.45%


+16.08%
+16.08%
+16.08%
-1.74%
+4.54%
+$0.39
-$-0.0
+$0.1
+2.23%
-$1K
-$966
-$1K
-$966
-$1K
-$966
-$1K
-$966
+5.45%
-1.74%
-$989.27
-263.11%
-263.11%
-263.11%
-4.53%
-$-0.0
+$0.1
-$1K
-$966
-$-0.0
+$0.1
+16.08%
+16.08%
+16.08%
+5.45%
+2.23%
+$0.39
-$-0.0
+$0.1
-2.22%
-$-0.0
+$0.1
-$1K
-$966
-$-0.0
+$0.1
+16.08%
+16.08%
+16.08%
+5.45%
+12.5%
+$0.39
-$-0.0
+$0.1
+2.35%
-$-0.0
+$0.1
-$-0.0
+$0.1
+$0.02
+$0.89
+16.08%
+16.08%
+16.08%
+5.45%
+12.5%
+$0.39
-$-0.0
+$0.1
+1.22%

Recommendations
Lorem ipsum dolor sit amet, consectetur adipiscing elit. Morbi sed pharetra massa. Aenean iaculis molestie fringilla. Vivamus id tortor eget mauris tincidunt vestibulum ut a lacus. Vivamus eget efficitur urna, a vehicula magna. Duis eu lectus sed eros faucibus gravida vel non urna. Aliquam in aliquam ipsum. Praesent vitae.
Table Settings
Metric:
Cohort Metrics


Slicer
Choose Slicer
Groups

Group a vs. Control

Group B vs. Control

Group C vs. Control


Range
0.02$-2.22$

Lucy_Cards_2023
Stop
Finished

FL
aB testing


P
v 1.2.0
Summary
analysis

Filter
Last update
5 min ago

Vibe Coding Widget Center | 2026
Redesigned a modular dashboard and widget center, leveraging Vibe Coding with Claude Code to rapidly transform high-level design concepts into a fully functional frontend.
View Project

New Installs by Groups
Control Group
Group A
Group B
Group C
0
50
100
150
200
Num. New Installs
113
New Installs Over Time
0
50
100
150
200
250
300
350
400
01.01
05.01
10.01
15.01
20.01
25.01
30.01
Retention
Control Group
Group A
Group B
Group C
07
dormant PU
dormant PU
3.45%
3.45%
Groups
Average
Lift
Number of Players
Absolute Change
group A VS. Control
29.75%
234,212
2.5%
1300
group B VS. Control
42.15% (40,222)
234,212
2.5%
1034
group C VS. Control
25.32% (45,323)
234,212
2.5%
734
06
cristian inapp september 8
+
45
-
14
06
new players
-
112
+
328
250%
200%
150%
100%
50%
10%
01.01
05.01
10.01
15.01
20.01
25.01
30.01
Retention
07.01
Group C
83%
Group B
65%
Control Group
56%
Group A
55%
Total New Installs (All groups)
20, 000
Lucy_Cards_2023
Stop
Finished
FL
aB testing
P
v 1.2.0
Summary
analysis
Summary
analysis
Date Range:
Last 7 Days
Group A vs. Control
Lift
Increase
CI Lift
Group B vs. Control
Lift
Increase
CI Lift
Group D vs. Control
Lift
Increase
CI Lift
Metrics
Metric
Gross Revenue
Goal Metric
Retention Day 1
Retention Day 7
Retention Day 14
Retention Day 30
Conversion Day 1
Conversion Day 7
Conversion Day 14
Conversion Day 30
ARPI Day 1
ARPI Day 7
ARPI Day 14
ARPI Day 30
+5.77%
+5.77%
-3.45%
+5.77%
+4.54%
-4.54%
-$1K
-$966
-1.74%
+4.54%
-$989.27
-263.11%
-263.11%
-263.11%
+2.33%
+16.08%
+16.08%
+16.08%
+23.32%
+2.23%
+$0.39
-$-0.0
+$0.1
-1.23%
+16.08%
+16.08%
+16.08%
+2.23%
-1.23%
+$0.39
-$-0.0
+$0.1
-1.67%
+16.08%
+16.08%
+16.08%
-1.23%
+12.5%
+$0.39
-$-0.0
+$0.1
+12.5%
-$1K
-$966
-1.74%
-1.74%
-$989.27
-263.11%
-263.11%
-263.11%
+4.54%
+16.08%
+16.08%
+16.08%
-1.74%
-1.74%
+$0.39
-$-0.0
+$0.1
+2.43%
+16.08%
+16.08%
+16.08%
-1.74%
+2.23%
+$0.39
-$-0.0
+$0.1
+5.45%
+16.08%
+16.08%
+16.08%
-1.74%
+4.54%
+$0.39
-$-0.0
+$0.1
+2.23%
-$1K
-$966
-$1K
-$966
-$1K
-$966
-$1K
-$966
+5.45%
-1.74%
-$989.27
-263.11%
-263.11%
-263.11%
-4.53%
-$-0.0
+$0.1
-$1K
-$966
-$-0.0
+$0.1
+16.08%
+16.08%
+16.08%
+5.45%
+2.23%
+$0.39
-$-0.0
+$0.1
-2.22%
-$-0.0
+$0.1
-$1K
-$966
-$-0.0
+$0.1
+16.08%
+16.08%
+16.08%
+5.45%
+12.5%
+$0.39
-$-0.0
+$0.1
+2.35%
-$-0.0
+$0.1
-$-0.0
+$0.1
+$0.02
+$0.89
+16.08%
+16.08%
+16.08%
+5.45%
+12.5%
+$0.39
-$-0.0
+$0.1
+1.22%
Recommendations
Lorem ipsum dolor sit amet, consectetur adipiscing elit. Morbi sed pharetra massa. Aenean iaculis molestie fringilla. Vivamus id tortor eget mauris tincidunt vestibulum ut a lacus. Vivamus eget efficitur urna, a vehicula magna. Duis eu lectus sed eros faucibus gravida vel non urna. Aliquam in aliquam ipsum. Praesent vitae.
Table Settings
Metric:
Cohort Metrics
Slicer
Choose Slicer
Groups
Group a vs. Control
Group B vs. Control
Group C vs. Control
Range
0.02$-2.22$
Lucy_Cards_2023
Stop
Finished
FL
aB testing
P
v 1.2.0
Summary
analysis
Filter
Last update
5 min ago
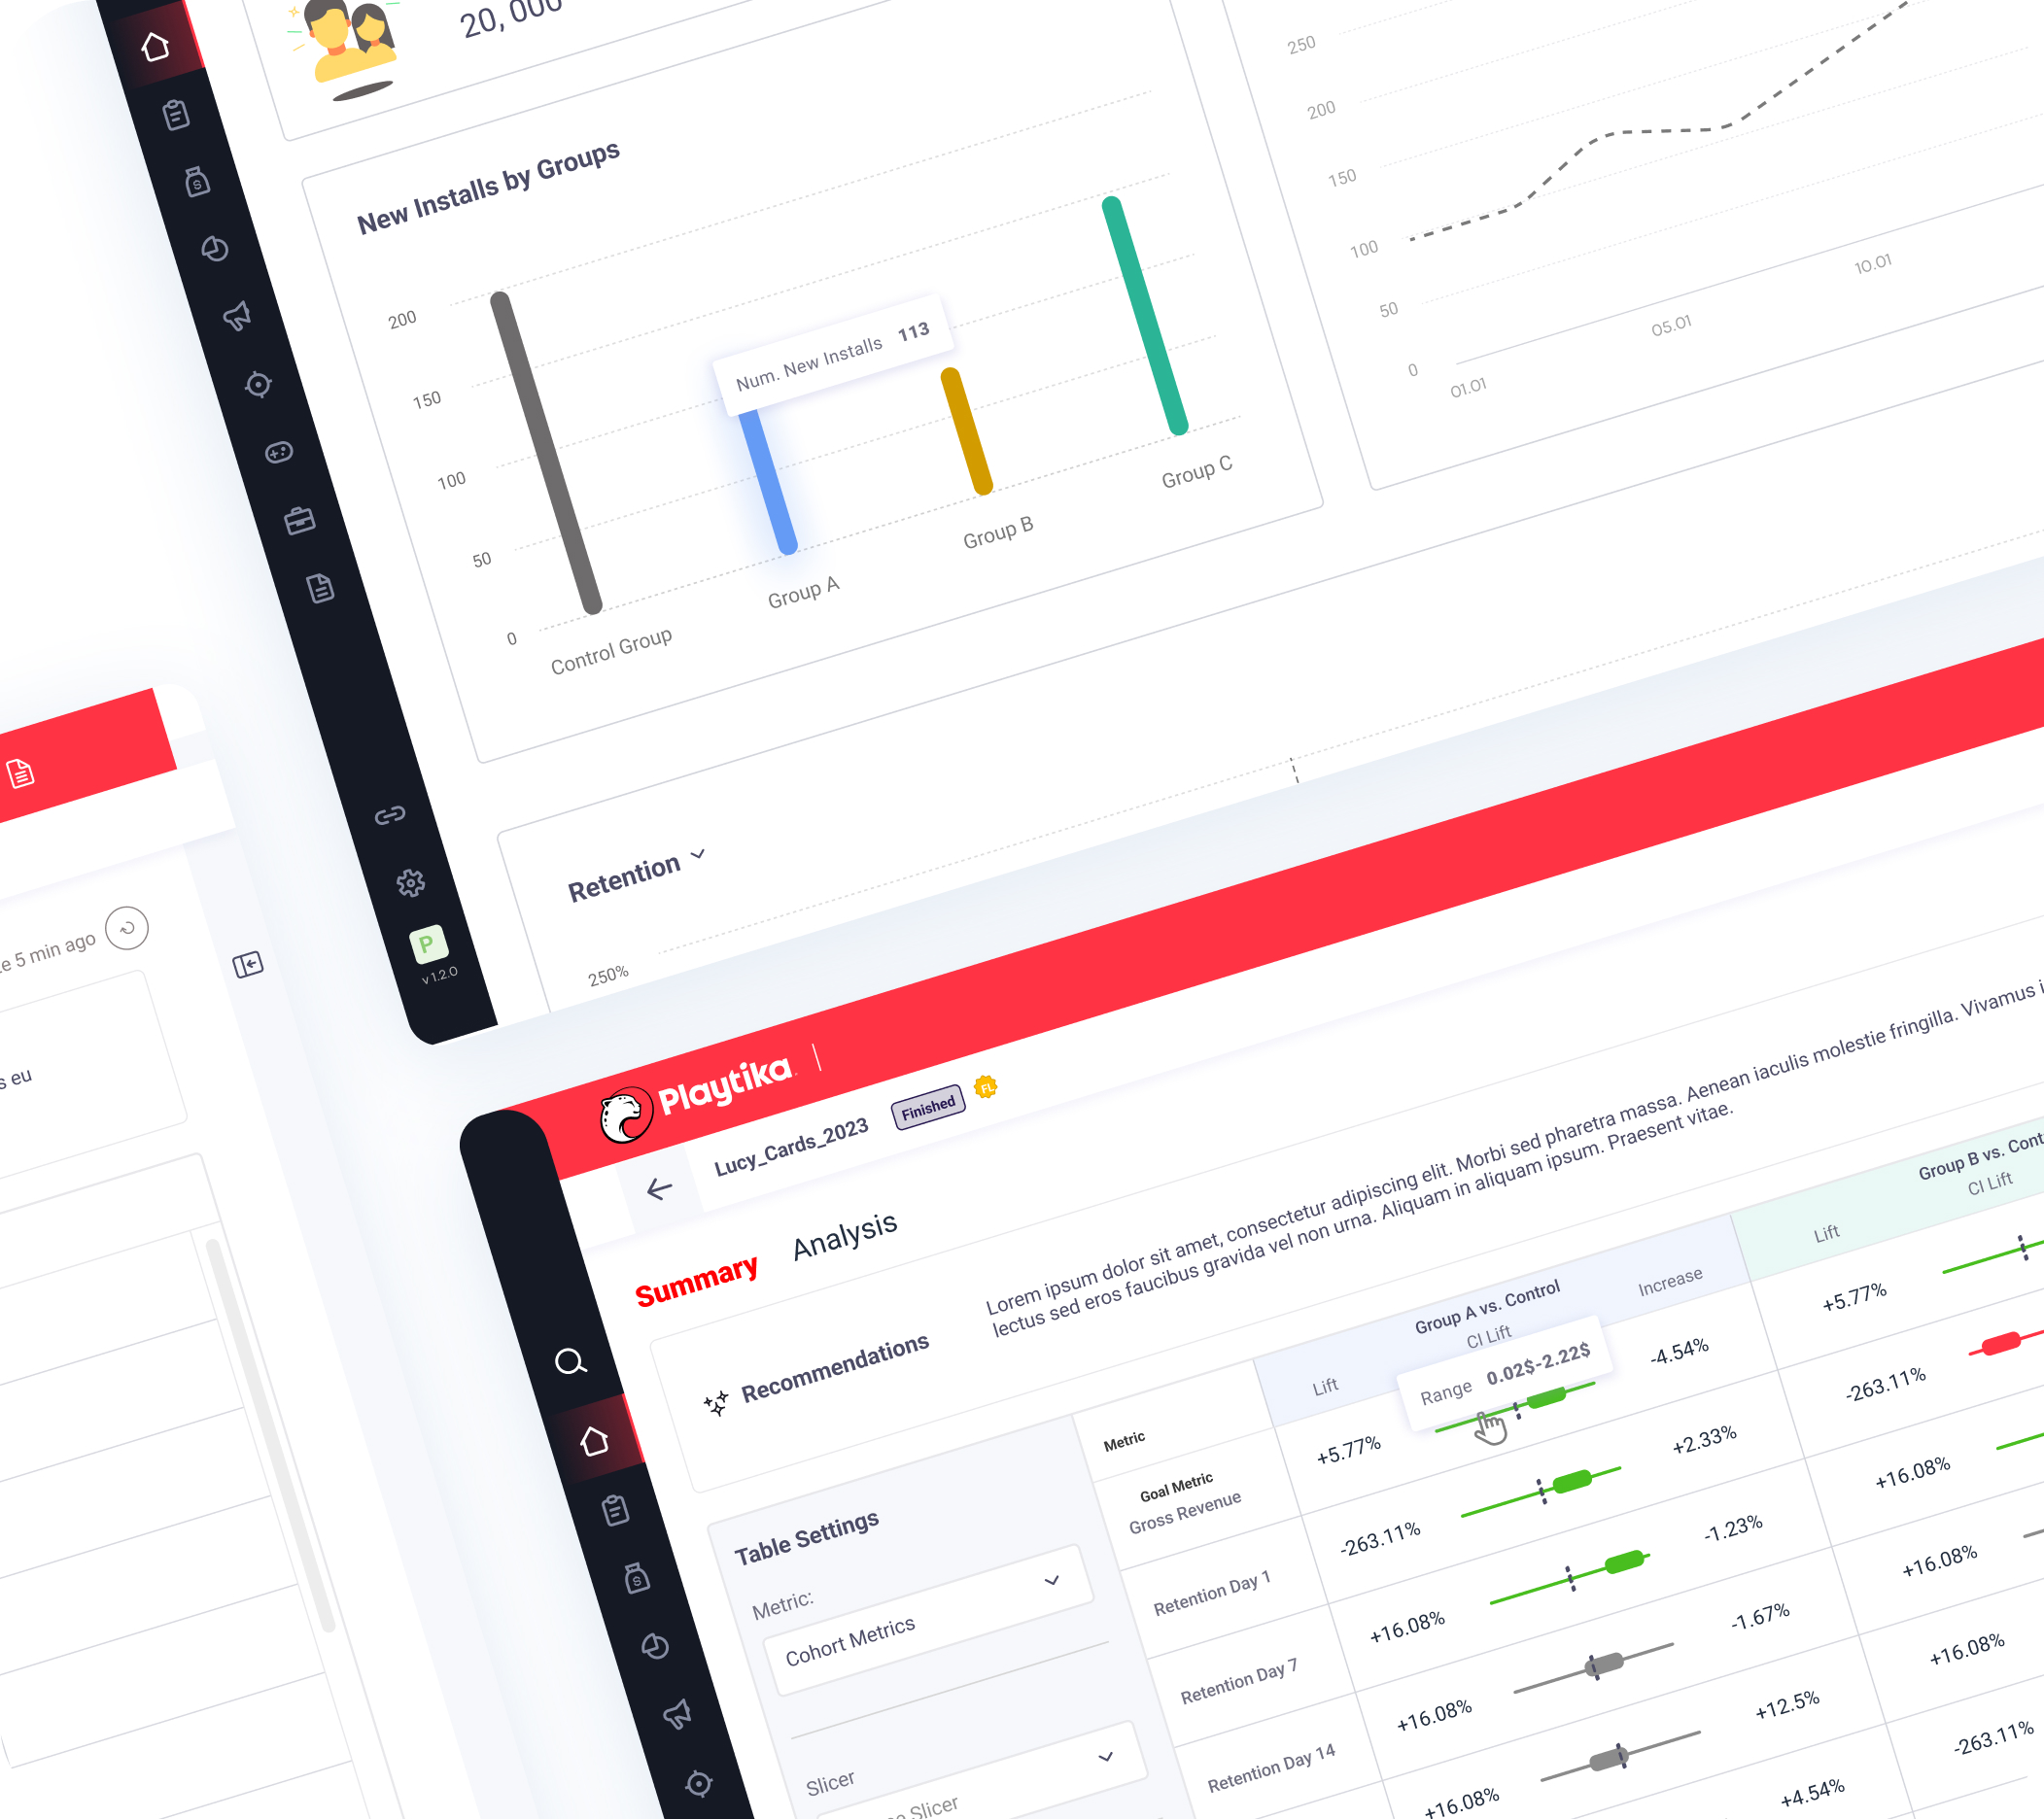
AB Testing | 2025
A/B testing optimizes game features via controlled experiments. While previous new installs test required external tools for, we designed a dedicated results page to centralize data and streamline the testing process.
View Project
New Installs by Groups
Control Group
Group A
Group B
Group C
0
50
100
150
200
Num. New Installs
113
New Installs Over Time
0
50
100
150
200
250
300
350
400
01.01
05.01
10.01
15.01
20.01
25.01
30.01
Retention
Control Group
Group A
Group B
Group C
07
dormant PU
dormant PU
3.45%
3.45%
Groups
Average
Lift
Number of Players
Absolute Change
group A VS. Control
29.75%
234,212
2.5%
1300
group B VS. Control
42.15% (40,222)
234,212
2.5%
1034
group C VS. Control
25.32% (45,323)
234,212
2.5%
734
06
cristian inapp september 8
+
45
-
14
06
new players
-
112
+
328
250%
200%
150%
100%
50%
10%
01.01
05.01
10.01
15.01
20.01
25.01
30.01
Retention
07.01
Group C
83%
Group B
65%
Control Group
56%
Group A
55%
Total New Installs (All groups)
20, 000
Lucy_Cards_2023
Stop
Finished
FL
aB testing
P
v 1.2.0
Summary
analysis
Summary
analysis
Date Range:
Last 7 Days
Group A vs. Control
Lift
Increase
CI Lift
Group B vs. Control
Lift
Increase
CI Lift
Group D vs. Control
Lift
Increase
CI Lift
Metrics
Metric
Gross Revenue
Goal Metric
Retention Day 1
Retention Day 7
Retention Day 14
Retention Day 30
Conversion Day 1
Conversion Day 7
Conversion Day 14
Conversion Day 30
ARPI Day 1
ARPI Day 7
ARPI Day 14
ARPI Day 30
+5.77%
+5.77%
-3.45%
+5.77%
+4.54%
-4.54%
-$1K
-$966
-1.74%
+4.54%
-$989.27
-263.11%
-263.11%
-263.11%
+2.33%
+16.08%
+16.08%
+16.08%
+23.32%
+2.23%
+$0.39
-$-0.0
+$0.1
-1.23%
+16.08%
+16.08%
+16.08%
+2.23%
-1.23%
+$0.39
-$-0.0
+$0.1
-1.67%
+16.08%
+16.08%
+16.08%
-1.23%
+12.5%
+$0.39
-$-0.0
+$0.1
+12.5%
-$1K
-$966
-1.74%
-1.74%
-$989.27
-263.11%
-263.11%
-263.11%
+4.54%
+16.08%
+16.08%
+16.08%
-1.74%
-1.74%
+$0.39
-$-0.0
+$0.1
+2.43%
+16.08%
+16.08%
+16.08%
-1.74%
+2.23%
+$0.39
-$-0.0
+$0.1
+5.45%
+16.08%
+16.08%
+16.08%
-1.74%
+4.54%
+$0.39
-$-0.0
+$0.1
+2.23%
-$1K
-$966
-$1K
-$966
-$1K
-$966
-$1K
-$966
+5.45%
-1.74%
-$989.27
-263.11%
-263.11%
-263.11%
-4.53%
-$-0.0
+$0.1
-$1K
-$966
-$-0.0
+$0.1
+16.08%
+16.08%
+16.08%
+5.45%
+2.23%
+$0.39
-$-0.0
+$0.1
-2.22%
-$-0.0
+$0.1
-$1K
-$966
-$-0.0
+$0.1
+16.08%
+16.08%
+16.08%
+5.45%
+12.5%
+$0.39
-$-0.0
+$0.1
+2.35%
-$-0.0
+$0.1
-$-0.0
+$0.1
+$0.02
+$0.89
+16.08%
+16.08%
+16.08%
+5.45%
+12.5%
+$0.39
-$-0.0
+$0.1
+1.22%
Recommendations
Lorem ipsum dolor sit amet, consectetur adipiscing elit. Morbi sed pharetra massa. Aenean iaculis molestie fringilla. Vivamus id tortor eget mauris tincidunt vestibulum ut a lacus. Vivamus eget efficitur urna, a vehicula magna. Duis eu lectus sed eros faucibus gravida vel non urna. Aliquam in aliquam ipsum. Praesent vitae.
Table Settings
Metric:
Cohort Metrics
Slicer
Choose Slicer
Groups
Group a vs. Control
Group B vs. Control
Group C vs. Control
Range
0.02$-2.22$
Lucy_Cards_2023
Stop
Finished
FL
aB testing
P
v 1.2.0
Summary
analysis
Filter
Last update
5 min ago
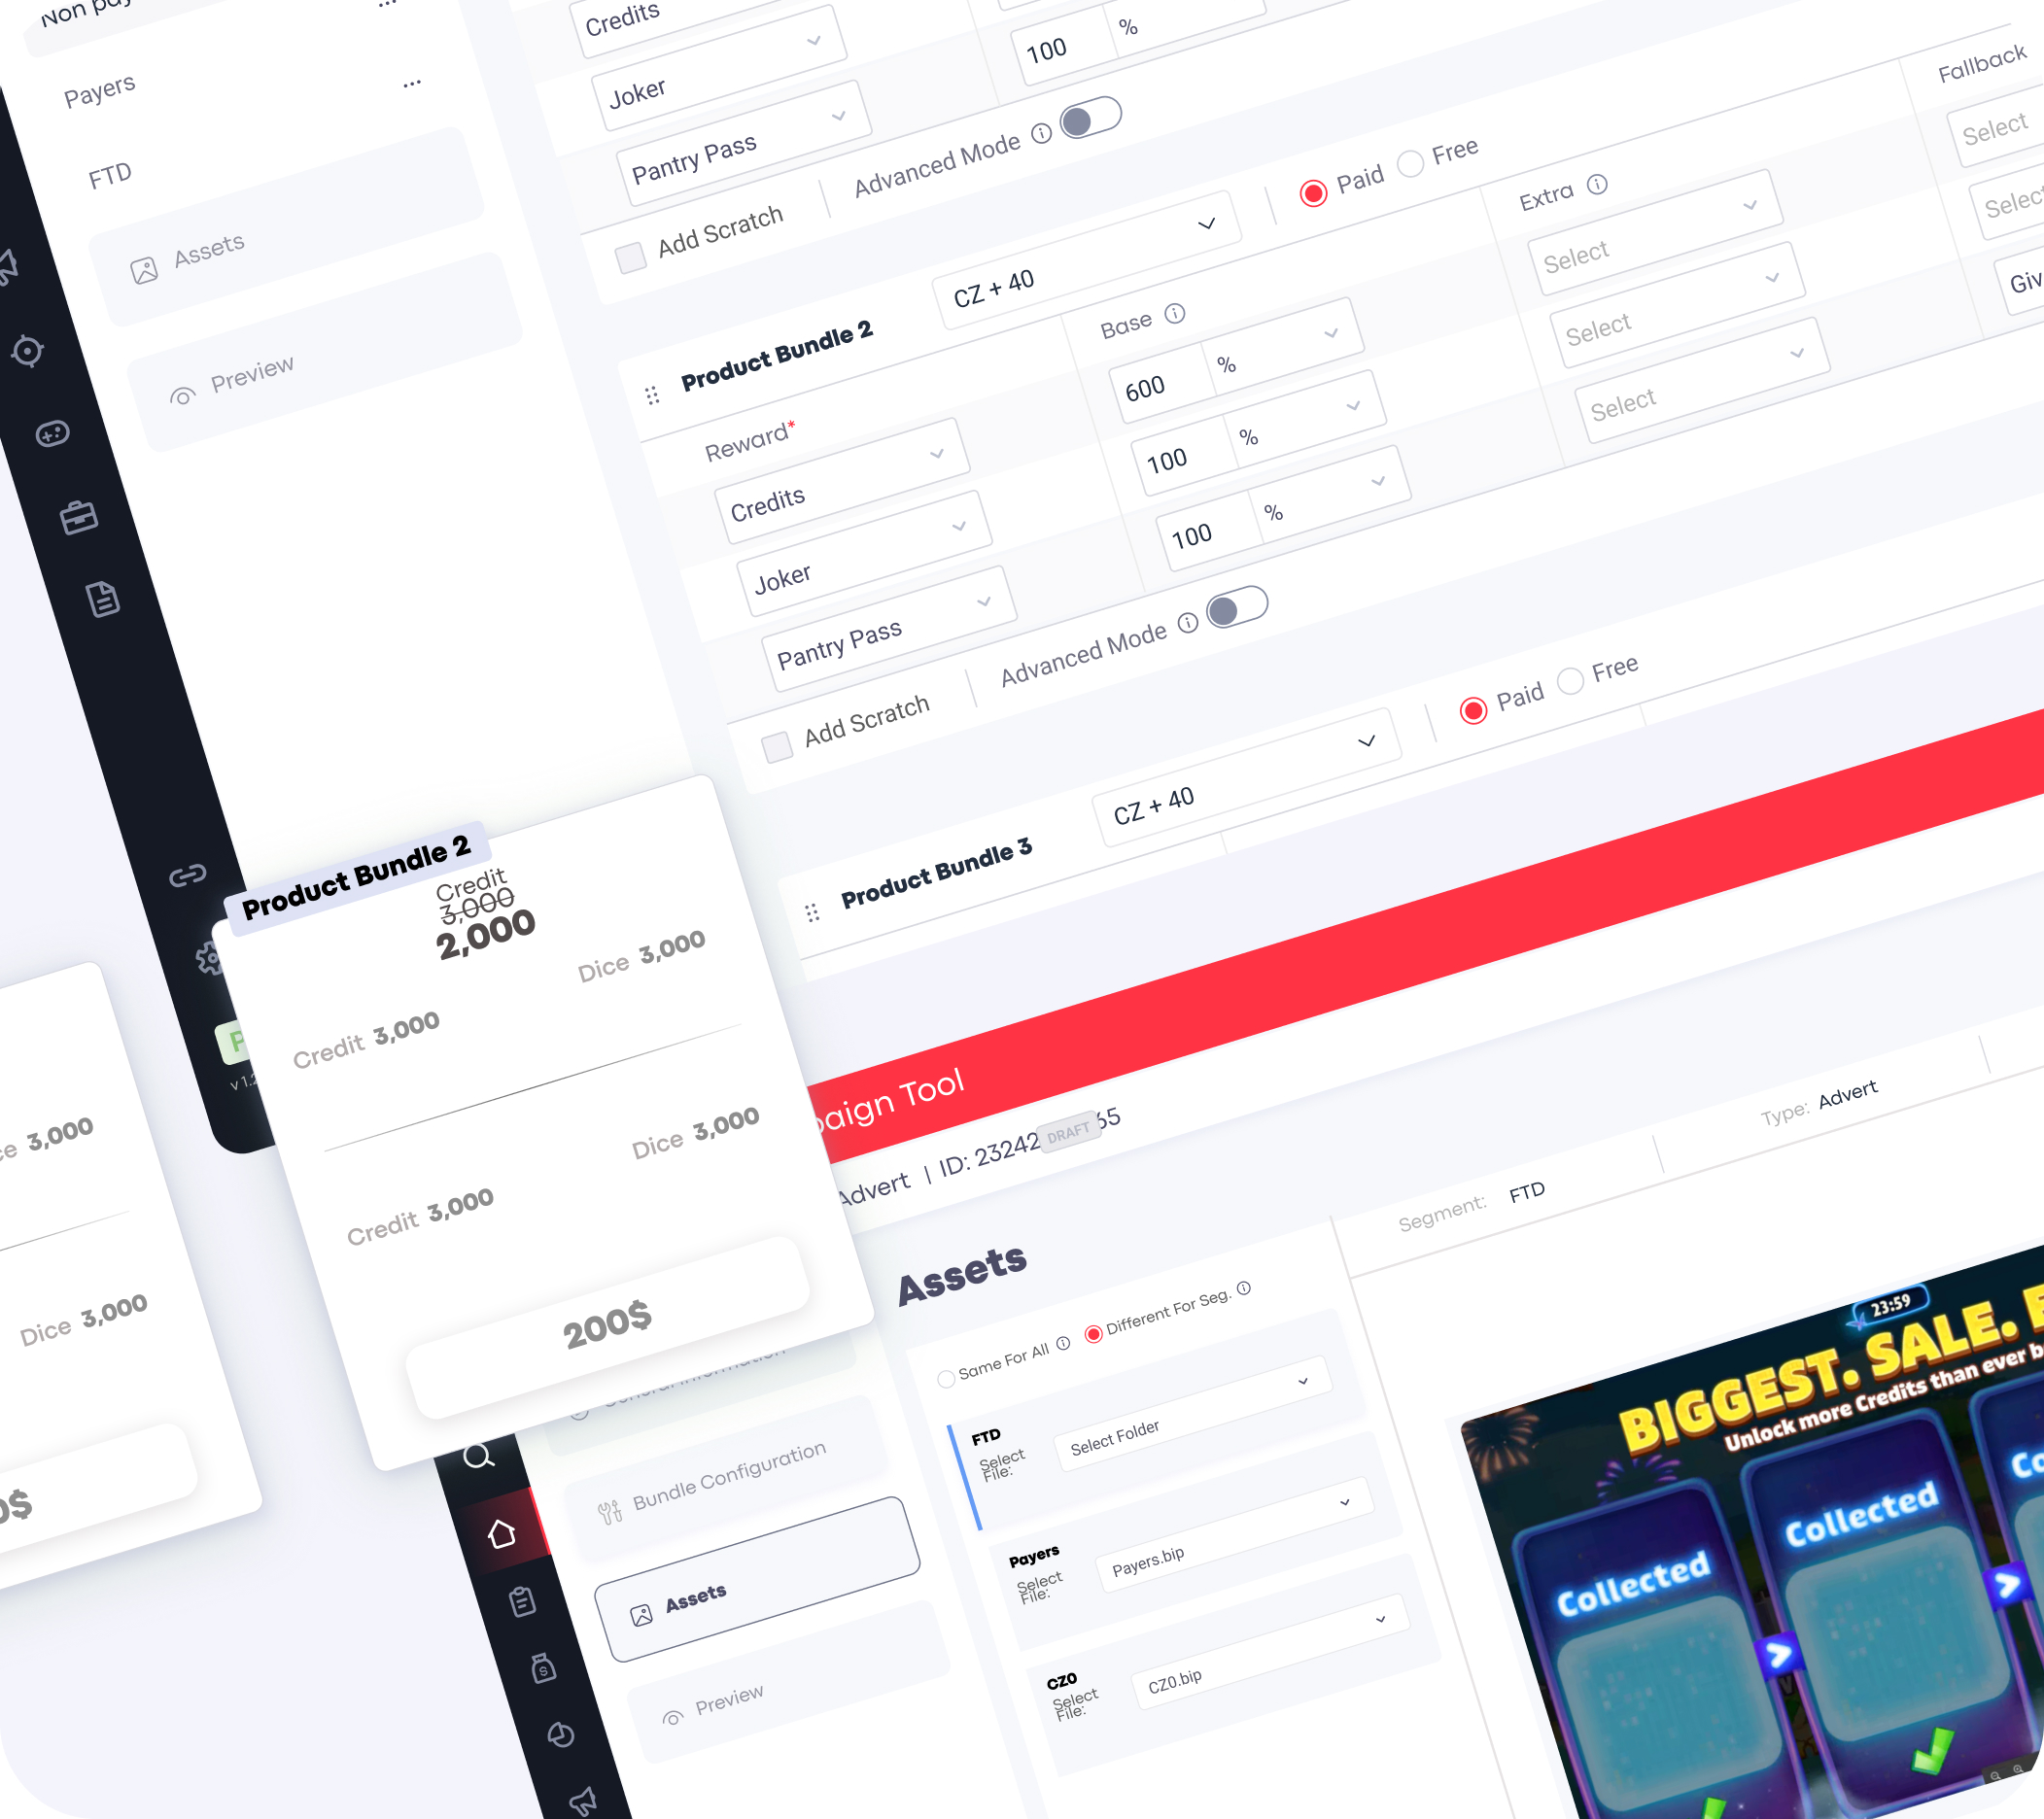
Campaign Tool 2.0 | 2025
Campaign Tool 2.0 streamlines in-game offer creation and multi-persona collaboration. The goal was to redesign the tool with a streamlined user flow and updated interface.
View Project
New Installs by Groups
Control Group
Group A
Group B
Group C
0
50
100
150
200
Num. New Installs
113
New Installs Over Time
0
50
100
150
200
250
300
350
400
01.01
05.01
10.01
15.01
20.01
25.01
30.01
Retention
Control Group
Group A
Group B
Group C
07
dormant PU
dormant PU
3.45%
3.45%
Groups
Average
Lift
Number of Players
Absolute Change
group A VS. Control
29.75%
234,212
2.5%
1300
group B VS. Control
42.15% (40,222)
234,212
2.5%
1034
group C VS. Control
25.32% (45,323)
234,212
2.5%
734
06
cristian inapp september 8
+
45
-
14
06
new players
-
112
+
328
250%
200%
150%
100%
50%
10%
01.01
05.01
10.01
15.01
20.01
25.01
30.01
Retention
07.01
Group C
83%
Group B
65%
Control Group
56%
Group A
55%
Total New Installs (All groups)
20, 000
Lucy_Cards_2023
Stop
Finished
FL
aB testing
P
v 1.2.0
Summary
analysis
Summary
analysis
Date Range:
Last 7 Days
Group A vs. Control
Lift
Increase
CI Lift
Group B vs. Control
Lift
Increase
CI Lift
Group D vs. Control
Lift
Increase
CI Lift
Metrics
Metric
Gross Revenue
Goal Metric
Retention Day 1
Retention Day 7
Retention Day 14
Retention Day 30
Conversion Day 1
Conversion Day 7
Conversion Day 14
Conversion Day 30
ARPI Day 1
ARPI Day 7
ARPI Day 14
ARPI Day 30
+5.77%
+5.77%
-3.45%
+5.77%
+4.54%
-4.54%
-$1K
-$966
-1.74%
+4.54%
-$989.27
-263.11%
-263.11%
-263.11%
+2.33%
+16.08%
+16.08%
+16.08%
+23.32%
+2.23%
+$0.39
-$-0.0
+$0.1
-1.23%
+16.08%
+16.08%
+16.08%
+2.23%
-1.23%
+$0.39
-$-0.0
+$0.1
-1.67%
+16.08%
+16.08%
+16.08%
-1.23%
+12.5%
+$0.39
-$-0.0
+$0.1
+12.5%
-$1K
-$966
-1.74%
-1.74%
-$989.27
-263.11%
-263.11%
-263.11%
+4.54%
+16.08%
+16.08%
+16.08%
-1.74%
-1.74%
+$0.39
-$-0.0
+$0.1
+2.43%
+16.08%
+16.08%
+16.08%
-1.74%
+2.23%
+$0.39
-$-0.0
+$0.1
+5.45%
+16.08%
+16.08%
+16.08%
-1.74%
+4.54%
+$0.39
-$-0.0
+$0.1
+2.23%
-$1K
-$966
-$1K
-$966
-$1K
-$966
-$1K
-$966
+5.45%
-1.74%
-$989.27
-263.11%
-263.11%
-263.11%
-4.53%
-$-0.0
+$0.1
-$1K
-$966
-$-0.0
+$0.1
+16.08%
+16.08%
+16.08%
+5.45%
+2.23%
+$0.39
-$-0.0
+$0.1
-2.22%
-$-0.0
+$0.1
-$1K
-$966
-$-0.0
+$0.1
+16.08%
+16.08%
+16.08%
+5.45%
+12.5%
+$0.39
-$-0.0
+$0.1
+2.35%
-$-0.0
+$0.1
-$-0.0
+$0.1
+$0.02
+$0.89
+16.08%
+16.08%
+16.08%
+5.45%
+12.5%
+$0.39
-$-0.0
+$0.1
+1.22%
Recommendations
Lorem ipsum dolor sit amet, consectetur adipiscing elit. Morbi sed pharetra massa. Aenean iaculis molestie fringilla. Vivamus id tortor eget mauris tincidunt vestibulum ut a lacus. Vivamus eget efficitur urna, a vehicula magna. Duis eu lectus sed eros faucibus gravida vel non urna. Aliquam in aliquam ipsum. Praesent vitae.
Table Settings
Metric:
Cohort Metrics
Slicer
Choose Slicer
Groups
Group a vs. Control
Group B vs. Control
Group C vs. Control
Range
0.02$-2.22$
Lucy_Cards_2023
Stop
Finished
FL
aB testing
P
v 1.2.0
Summary
analysis
Filter
Last update
5 min ago
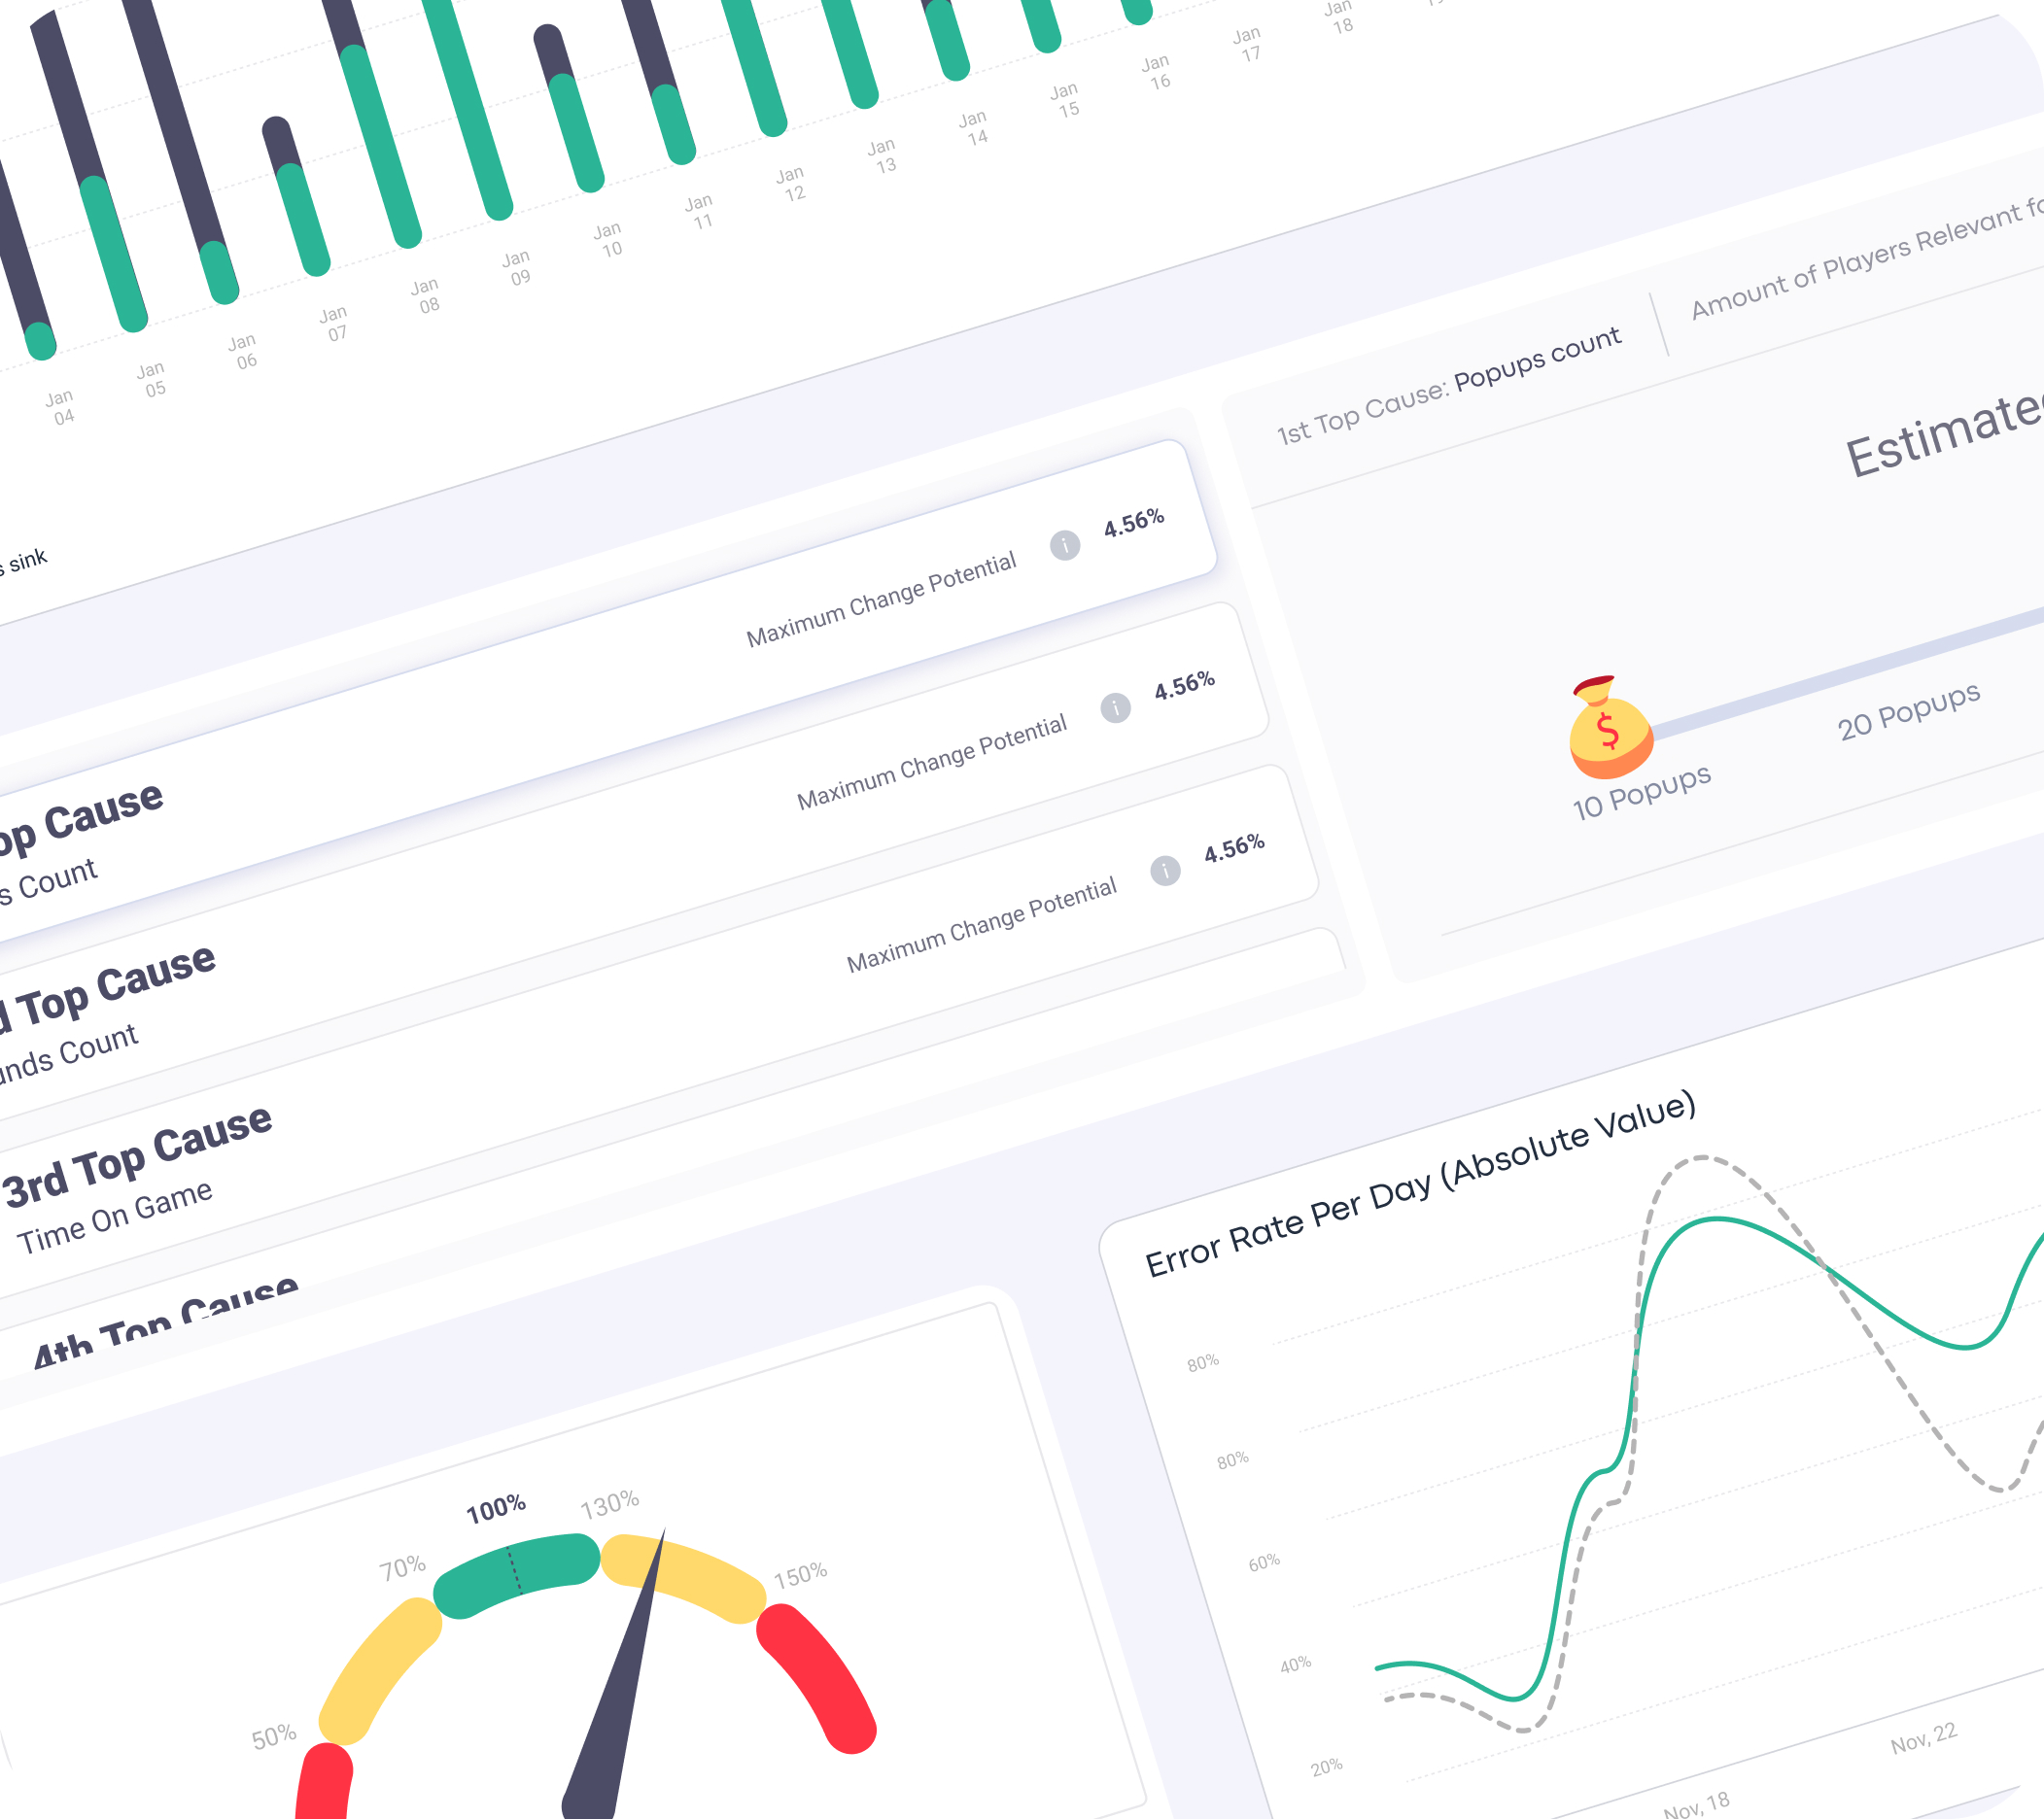
Detector | 2025
Coming Soon
© 2026 by Adi Barkan Maor
Adi Barkan Maor
Home
About
Resume
Hello, I’m Adi!
Product Designer at Optimove (Previously -Playtika) with an MA in Neuroscience and more than 4 years of experience. I bridge the gap between cognitive science and UX, leveraging AI to build human-centered experiences.
New Installs by Groups


Control Group
Group A
Group B
Group C
0
50
100
150
200
Num. New Installs
113
New Installs Over Time
0
50
100
150
200
250
300
350
400

01.01
05.01
10.01
15.01
20.01
25.01
30.01
Retention


Control Group

Group A

Group B

Group C
07
dormant PU
dormant PU

3.45%

3.45%

Groups
Average

Lift
Number of Players
Absolute Change
group A VS. Control
29.75%
234,212
2.5%
1300
group B VS. Control
42.15% (40,222)
234,212
2.5%
1034
group C VS. Control
25.32% (45,323)
234,212
2.5%
734
06
cristian inapp september 8
+
45
-
14
06
new players
-
112
+
328


250%
200%
150%
100%
50%
10%
01.01
05.01
10.01
15.01
20.01
25.01
30.01


Retention
07.01

Group C
83%

Group B
65%

Control Group
56%

Group A
55%


Total New Installs (All groups)
20, 000


Lucy_Cards_2023
Stop
Finished

FL


aB testing


P
v 1.2.0
Summary
analysis
Summary
analysis
Date Range:
Last 7 Days

Group A vs. Control
Lift
Increase
CI Lift

Group B vs. Control
Lift
Increase
CI Lift
Group D vs. Control
Lift
Increase
CI Lift
Metrics
Metric

Gross Revenue
Goal Metric
Retention Day 1
Retention Day 7
Retention Day 14
Retention Day 30
Conversion Day 1
Conversion Day 7
Conversion Day 14
Conversion Day 30
ARPI Day 1
ARPI Day 7
ARPI Day 14
ARPI Day 30


+5.77%
+5.77%
-3.45%
+5.77%

+4.54%
-4.54%


-$1K
-$966
-1.74%
+4.54%
-$989.27
-263.11%
-263.11%
-263.11%
+2.33%


+16.08%
+16.08%
+16.08%
+23.32%
+2.23%
+$0.39
-$-0.0
+$0.1
-1.23%


+16.08%
+16.08%
+16.08%
+2.23%
-1.23%
+$0.39
-$-0.0
+$0.1
-1.67%


+16.08%
+16.08%
+16.08%
-1.23%
+12.5%
+$0.39
-$-0.0
+$0.1
+12.5%


-$1K
-$966
-1.74%
-1.74%
-$989.27
-263.11%
-263.11%
-263.11%
+4.54%


+16.08%
+16.08%
+16.08%
-1.74%
-1.74%
+$0.39
-$-0.0
+$0.1
+2.43%


+16.08%
+16.08%
+16.08%
-1.74%
+2.23%
+$0.39
-$-0.0
+$0.1
+5.45%


+16.08%
+16.08%
+16.08%
-1.74%
+4.54%
+$0.39
-$-0.0
+$0.1
+2.23%
-$1K
-$966
-$1K
-$966
-$1K
-$966
-$1K
-$966
+5.45%
-1.74%
-$989.27
-263.11%
-263.11%
-263.11%
-4.53%
-$-0.0
+$0.1
-$1K
-$966
-$-0.0
+$0.1
+16.08%
+16.08%
+16.08%
+5.45%
+2.23%
+$0.39
-$-0.0
+$0.1
-2.22%
-$-0.0
+$0.1
-$1K
-$966
-$-0.0
+$0.1
+16.08%
+16.08%
+16.08%
+5.45%
+12.5%
+$0.39
-$-0.0
+$0.1
+2.35%
-$-0.0
+$0.1
-$-0.0
+$0.1
+$0.02
+$0.89
+16.08%
+16.08%
+16.08%
+5.45%
+12.5%
+$0.39
-$-0.0
+$0.1
+1.22%

Recommendations
Lorem ipsum dolor sit amet, consectetur adipiscing elit. Morbi sed pharetra massa. Aenean iaculis molestie fringilla. Vivamus id tortor eget mauris tincidunt vestibulum ut a lacus. Vivamus eget efficitur urna, a vehicula magna. Duis eu lectus sed eros faucibus gravida vel non urna. Aliquam in aliquam ipsum. Praesent vitae.
Table Settings
Metric:
Cohort Metrics


Slicer
Choose Slicer
Groups

Group a vs. Control

Group B vs. Control

Group C vs. Control


Range
0.02$-2.22$

Lucy_Cards_2023
Stop
Finished

FL
aB testing


P
v 1.2.0
Summary
analysis

Filter
Last update
5 min ago

Vibe Coding Widget Center | 2026
Redesigned a modular dashboard and widget center, leveraging Vibe Coding with Claude Code to rapidly transform high-level design concepts into a fully functional frontend.
View Project
New Installs by Groups
Control Group
Group A
Group B
Group C
0
50
100
150
200
Num. New Installs
113
New Installs Over Time
0
50
100
150
200
250
300
350
400
01.01
05.01
10.01
15.01
20.01
25.01
30.01
Retention
Control Group
Group A
Group B
Group C
07
dormant PU
dormant PU
3.45%
3.45%
Groups
Average
Lift
Number of Players
Absolute Change
group A VS. Control
29.75%
234,212
2.5%
1300
group B VS. Control
42.15% (40,222)
234,212
2.5%
1034
group C VS. Control
25.32% (45,323)
234,212
2.5%
734
06
cristian inapp september 8
+
45
-
14
06
new players
-
112
+
328
250%
200%
150%
100%
50%
10%
01.01
05.01
10.01
15.01
20.01
25.01
30.01
Retention
07.01
Group C
83%
Group B
65%
Control Group
56%
Group A
55%
Total New Installs (All groups)
20, 000
Lucy_Cards_2023
Stop
Finished
FL
aB testing
P
v 1.2.0
Summary
analysis
Summary
analysis
Date Range:
Last 7 Days
Group A vs. Control
Lift
Increase
CI Lift
Group B vs. Control
Lift
Increase
CI Lift
Group D vs. Control
Lift
Increase
CI Lift
Metrics
Metric
Gross Revenue
Goal Metric
Retention Day 1
Retention Day 7
Retention Day 14
Retention Day 30
Conversion Day 1
Conversion Day 7
Conversion Day 14
Conversion Day 30
ARPI Day 1
ARPI Day 7
ARPI Day 14
ARPI Day 30
+5.77%
+5.77%
-3.45%
+5.77%
+4.54%
-4.54%
-$1K
-$966
-1.74%
+4.54%
-$989.27
-263.11%
-263.11%
-263.11%
+2.33%
+16.08%
+16.08%
+16.08%
+23.32%
+2.23%
+$0.39
-$-0.0
+$0.1
-1.23%
+16.08%
+16.08%
+16.08%
+2.23%
-1.23%
+$0.39
-$-0.0
+$0.1
-1.67%
+16.08%
+16.08%
+16.08%
-1.23%
+12.5%
+$0.39
-$-0.0
+$0.1
+12.5%
-$1K
-$966
-1.74%
-1.74%
-$989.27
-263.11%
-263.11%
-263.11%
+4.54%
+16.08%
+16.08%
+16.08%
-1.74%
-1.74%
+$0.39
-$-0.0
+$0.1
+2.43%
+16.08%
+16.08%
+16.08%
-1.74%
+2.23%
+$0.39
-$-0.0
+$0.1
+5.45%
+16.08%
+16.08%
+16.08%
-1.74%
+4.54%
+$0.39
-$-0.0
+$0.1
+2.23%
-$1K
-$966
-$1K
-$966
-$1K
-$966
-$1K
-$966
+5.45%
-1.74%
-$989.27
-263.11%
-263.11%
-263.11%
-4.53%
-$-0.0
+$0.1
-$1K
-$966
-$-0.0
+$0.1
+16.08%
+16.08%
+16.08%
+5.45%
+2.23%
+$0.39
-$-0.0
+$0.1
-2.22%
-$-0.0
+$0.1
-$1K
-$966
-$-0.0
+$0.1
+16.08%
+16.08%
+16.08%
+5.45%
+12.5%
+$0.39
-$-0.0
+$0.1
+2.35%
-$-0.0
+$0.1
-$-0.0
+$0.1
+$0.02
+$0.89
+16.08%
+16.08%
+16.08%
+5.45%
+12.5%
+$0.39
-$-0.0
+$0.1
+1.22%
Recommendations
Lorem ipsum dolor sit amet, consectetur adipiscing elit. Morbi sed pharetra massa. Aenean iaculis molestie fringilla. Vivamus id tortor eget mauris tincidunt vestibulum ut a lacus. Vivamus eget efficitur urna, a vehicula magna. Duis eu lectus sed eros faucibus gravida vel non urna. Aliquam in aliquam ipsum. Praesent vitae.
Table Settings
Metric:
Cohort Metrics
Slicer
Choose Slicer
Groups
Group a vs. Control
Group B vs. Control
Group C vs. Control
Range
0.02$-2.22$
Lucy_Cards_2023
Stop
Finished
FL
aB testing
P
v 1.2.0
Summary
analysis
Filter
Last update
5 min ago
AB Testing | 2025
A/B testing optimizes game features via controlled experiments. While previous new installs test required external tools for, we designed a dedicated results page to centralize data and streamline the testing process.
View Project
New Installs by Groups
Control Group
Group A
Group B
Group C
0
50
100
150
200
Num. New Installs
113
New Installs Over Time
0
50
100
150
200
250
300
350
400
01.01
05.01
10.01
15.01
20.01
25.01
30.01
Retention
Control Group
Group A
Group B
Group C
07
dormant PU
dormant PU
3.45%
3.45%
Groups
Average
Lift
Number of Players
Absolute Change
group A VS. Control
29.75%
234,212
2.5%
1300
group B VS. Control
42.15% (40,222)
234,212
2.5%
1034
group C VS. Control
25.32% (45,323)
234,212
2.5%
734
06
cristian inapp september 8
+
45
-
14
06
new players
-
112
+
328
250%
200%
150%
100%
50%
10%
01.01
05.01
10.01
15.01
20.01
25.01
30.01
Retention
07.01
Group C
83%
Group B
65%
Control Group
56%
Group A
55%
Total New Installs (All groups)
20, 000
Lucy_Cards_2023
Stop
Finished
FL
aB testing
P
v 1.2.0
Summary
analysis
Summary
analysis
Date Range:
Last 7 Days
Group A vs. Control
Lift
Increase
CI Lift
Group B vs. Control
Lift
Increase
CI Lift
Group D vs. Control
Lift
Increase
CI Lift
Metrics
Metric
Gross Revenue
Goal Metric
Retention Day 1
Retention Day 7
Retention Day 14
Retention Day 30
Conversion Day 1
Conversion Day 7
Conversion Day 14
Conversion Day 30
ARPI Day 1
ARPI Day 7
ARPI Day 14
ARPI Day 30
+5.77%
+5.77%
-3.45%
+5.77%
+4.54%
-4.54%
-$1K
-$966
-1.74%
+4.54%
-$989.27
-263.11%
-263.11%
-263.11%
+2.33%
+16.08%
+16.08%
+16.08%
+23.32%
+2.23%
+$0.39
-$-0.0
+$0.1
-1.23%
+16.08%
+16.08%
+16.08%
+2.23%
-1.23%
+$0.39
-$-0.0
+$0.1
-1.67%
+16.08%
+16.08%
+16.08%
-1.23%
+12.5%
+$0.39
-$-0.0
+$0.1
+12.5%
-$1K
-$966
-1.74%
-1.74%
-$989.27
-263.11%
-263.11%
-263.11%
+4.54%
+16.08%
+16.08%
+16.08%
-1.74%
-1.74%
+$0.39
-$-0.0
+$0.1
+2.43%
+16.08%
+16.08%
+16.08%
-1.74%
+2.23%
+$0.39
-$-0.0
+$0.1
+5.45%
+16.08%
+16.08%
+16.08%
-1.74%
+4.54%
+$0.39
-$-0.0
+$0.1
+2.23%
-$1K
-$966
-$1K
-$966
-$1K
-$966
-$1K
-$966
+5.45%
-1.74%
-$989.27
-263.11%
-263.11%
-263.11%
-4.53%
-$-0.0
+$0.1
-$1K
-$966
-$-0.0
+$0.1
+16.08%
+16.08%
+16.08%
+5.45%
+2.23%
+$0.39
-$-0.0
+$0.1
-2.22%
-$-0.0
+$0.1
-$1K
-$966
-$-0.0
+$0.1
+16.08%
+16.08%
+16.08%
+5.45%
+12.5%
+$0.39
-$-0.0
+$0.1
+2.35%
-$-0.0
+$0.1
-$-0.0
+$0.1
+$0.02
+$0.89
+16.08%
+16.08%
+16.08%
+5.45%
+12.5%
+$0.39
-$-0.0
+$0.1
+1.22%
Recommendations
Lorem ipsum dolor sit amet, consectetur adipiscing elit. Morbi sed pharetra massa. Aenean iaculis molestie fringilla. Vivamus id tortor eget mauris tincidunt vestibulum ut a lacus. Vivamus eget efficitur urna, a vehicula magna. Duis eu lectus sed eros faucibus gravida vel non urna. Aliquam in aliquam ipsum. Praesent vitae.
Table Settings
Metric:
Cohort Metrics
Slicer
Choose Slicer
Groups
Group a vs. Control
Group B vs. Control
Group C vs. Control
Range
0.02$-2.22$
Lucy_Cards_2023
Stop
Finished
FL
aB testing
P
v 1.2.0
Summary
analysis
Filter
Last update
5 min ago
Campaign Tool 2.0 | 2025
Campaign Tool 2.0 streamlines in-game offer creation and multi-persona collaboration. The goal was to redesign the tool with a streamlined user flow and updated interface.
View Project
New Installs by Groups
Control Group
Group A
Group B
Group C
0
50
100
150
200
Num. New Installs
113
New Installs Over Time
0
50
100
150
200
250
300
350
400
01.01
05.01
10.01
15.01
20.01
25.01
30.01
Retention
Control Group
Group A
Group B
Group C
07
dormant PU
dormant PU
3.45%
3.45%
Groups
Average
Lift
Number of Players
Absolute Change
group A VS. Control
29.75%
234,212
2.5%
1300
group B VS. Control
42.15% (40,222)
234,212
2.5%
1034
group C VS. Control
25.32% (45,323)
234,212
2.5%
734
06
cristian inapp september 8
+
45
-
14
06
new players
-
112
+
328
250%
200%
150%
100%
50%
10%
01.01
05.01
10.01
15.01
20.01
25.01
30.01
Retention
07.01
Group C
83%
Group B
65%
Control Group
56%
Group A
55%
Total New Installs (All groups)
20, 000
Lucy_Cards_2023
Stop
Finished
FL
aB testing
P
v 1.2.0
Summary
analysis
Summary
analysis
Date Range:
Last 7 Days
Group A vs. Control
Lift
Increase
CI Lift
Group B vs. Control
Lift
Increase
CI Lift
Group D vs. Control
Lift
Increase
CI Lift
Metrics
Metric
Gross Revenue
Goal Metric
Retention Day 1
Retention Day 7
Retention Day 14
Retention Day 30
Conversion Day 1
Conversion Day 7
Conversion Day 14
Conversion Day 30
ARPI Day 1
ARPI Day 7
ARPI Day 14
ARPI Day 30
+5.77%
+5.77%
-3.45%
+5.77%
+4.54%
-4.54%
-$1K
-$966
-1.74%
+4.54%
-$989.27
-263.11%
-263.11%
-263.11%
+2.33%
+16.08%
+16.08%
+16.08%
+23.32%
+2.23%
+$0.39
-$-0.0
+$0.1
-1.23%
+16.08%
+16.08%
+16.08%
+2.23%
-1.23%
+$0.39
-$-0.0
+$0.1
-1.67%
+16.08%
+16.08%
+16.08%
-1.23%
+12.5%
+$0.39
-$-0.0
+$0.1
+12.5%
-$1K
-$966
-1.74%
-1.74%
-$989.27
-263.11%
-263.11%
-263.11%
+4.54%
+16.08%
+16.08%
+16.08%
-1.74%
-1.74%
+$0.39
-$-0.0
+$0.1
+2.43%
+16.08%
+16.08%
+16.08%
-1.74%
+2.23%
+$0.39
-$-0.0
+$0.1
+5.45%
+16.08%
+16.08%
+16.08%
-1.74%
+4.54%
+$0.39
-$-0.0
+$0.1
+2.23%
-$1K
-$966
-$1K
-$966
-$1K
-$966
-$1K
-$966
+5.45%
-1.74%
-$989.27
-263.11%
-263.11%
-263.11%
-4.53%
-$-0.0
+$0.1
-$1K
-$966
-$-0.0
+$0.1
+16.08%
+16.08%
+16.08%
+5.45%
+2.23%
+$0.39
-$-0.0
+$0.1
-2.22%
-$-0.0
+$0.1
-$1K
-$966
-$-0.0
+$0.1
+16.08%
+16.08%
+16.08%
+5.45%
+12.5%
+$0.39
-$-0.0
+$0.1
+2.35%
-$-0.0
+$0.1
-$-0.0
+$0.1
+$0.02
+$0.89
+16.08%
+16.08%
+16.08%
+5.45%
+12.5%
+$0.39
-$-0.0
+$0.1
+1.22%
Recommendations
Lorem ipsum dolor sit amet, consectetur adipiscing elit. Morbi sed pharetra massa. Aenean iaculis molestie fringilla. Vivamus id tortor eget mauris tincidunt vestibulum ut a lacus. Vivamus eget efficitur urna, a vehicula magna. Duis eu lectus sed eros faucibus gravida vel non urna. Aliquam in aliquam ipsum. Praesent vitae.
Table Settings
Metric:
Cohort Metrics
Slicer
Choose Slicer
Groups
Group a vs. Control
Group B vs. Control
Group C vs. Control
Range
0.02$-2.22$
Lucy_Cards_2023
Stop
Finished
FL
aB testing
P
v 1.2.0
Summary
analysis
Filter
Last update
5 min ago
Detector | 2025
Coming Soon
© 2026 by Adi Barkan Maor
Adi Barkan Maor
Home
About
Resume

Hello,
I’m Adi!
Product Designer at Optimove (Previously -Playtika) with an MA in Neuroscience and more than 4 years of experience. I bridge the gap between cognitive science and UX, leveraging AI to build human-centered experiences.
New Installs by Groups
Control Group
Group A
Group B
Group C
0
50
100
150
200
Num. New Installs
113
New Installs Over Time
0
50
100
150
200
250
300
350
400
01.01
05.01
10.01
15.01
20.01
25.01
30.01
Retention
Control Group
Group A
Group B
Group C
07
dormant PU
dormant PU
3.45%
3.45%
Groups
Average
Lift
Number of Players
Absolute Change
group A VS. Control
29.75%
234,212
2.5%
1300
group B VS. Control
42.15% (40,222)
234,212
2.5%
1034
group C VS. Control
25.32% (45,323)
234,212
2.5%
734
06
cristian inapp september 8
+
45
-
14
06
new players
-
112
+
328
250%
200%
150%
100%
50%
10%
01.01
05.01
10.01
15.01
20.01
25.01
30.01
Retention
07.01
Group C
83%
Group B
65%
Control Group
56%
Group A
55%
Total New Installs (All groups)
20, 000
Lucy_Cards_2023
Stop
Finished
FL
aB testing
P
v 1.2.0
Summary
analysis
Summary
analysis
Date Range:
Last 7 Days
Group A vs. Control
Lift
Increase
CI Lift
Group B vs. Control
Lift
Increase
CI Lift
Group D vs. Control
Lift
Increase
CI Lift
Metrics
Metric
Gross Revenue
Goal Metric
Retention Day 1
Retention Day 7
Retention Day 14
Retention Day 30
Conversion Day 1
Conversion Day 7
Conversion Day 14
Conversion Day 30
ARPI Day 1
ARPI Day 7
ARPI Day 14
ARPI Day 30
+5.77%
+5.77%
-3.45%
+5.77%
+4.54%
-4.54%
-$1K
-$966
-1.74%
+4.54%
-$989.27
-263.11%
-263.11%
-263.11%
+2.33%
+16.08%
+16.08%
+16.08%
+23.32%
+2.23%
+$0.39
-$-0.0
+$0.1
-1.23%
+16.08%
+16.08%
+16.08%
+2.23%
-1.23%
+$0.39
-$-0.0
+$0.1
-1.67%
+16.08%
+16.08%
+16.08%
-1.23%
+12.5%
+$0.39
-$-0.0
+$0.1
+12.5%
-$1K
-$966
-1.74%
-1.74%
-$989.27
-263.11%
-263.11%
-263.11%
+4.54%
+16.08%
+16.08%
+16.08%
-1.74%
-1.74%
+$0.39
-$-0.0
+$0.1
+2.43%
+16.08%
+16.08%
+16.08%
-1.74%
+2.23%
+$0.39
-$-0.0
+$0.1
+5.45%
+16.08%
+16.08%
+16.08%
-1.74%
+4.54%
+$0.39
-$-0.0
+$0.1
+2.23%
-$1K
-$966
-$1K
-$966
-$1K
-$966
-$1K
-$966
+5.45%
-1.74%
-$989.27
-263.11%
-263.11%
-263.11%
-4.53%
-$-0.0
+$0.1
-$1K
-$966
-$-0.0
+$0.1
+16.08%
+16.08%
+16.08%
+5.45%
+2.23%
+$0.39
-$-0.0
+$0.1
-2.22%
-$-0.0
+$0.1
-$1K
-$966
-$-0.0
+$0.1
+16.08%
+16.08%
+16.08%
+5.45%
+12.5%
+$0.39
-$-0.0
+$0.1
+2.35%
-$-0.0
+$0.1
-$-0.0
+$0.1
+$0.02
+$0.89
+16.08%
+16.08%
+16.08%
+5.45%
+12.5%
+$0.39
-$-0.0
+$0.1
+1.22%

Recommendations
Lorem ipsum dolor sit amet, consectetur adipiscing elit. Morbi sed pharetra massa. Aenean iaculis molestie fringilla. Vivamus id tortor eget mauris tincidunt vestibulum ut a lacus. Vivamus eget efficitur urna, a vehicula magna. Duis eu lectus sed eros faucibus gravida vel non urna. Aliquam in aliquam ipsum. Praesent vitae.
Table Settings
Metric:
Cohort Metrics
Slicer
Choose Slicer
Groups
Group a vs. Control
Group B vs. Control
Group C vs. Control
Range
0.02$-2.22$
Lucy_Cards_2023
Stop
Finished
FL
aB testing
P
v 1.2.0
Summary
analysis
Filter
Last update
5 min ago
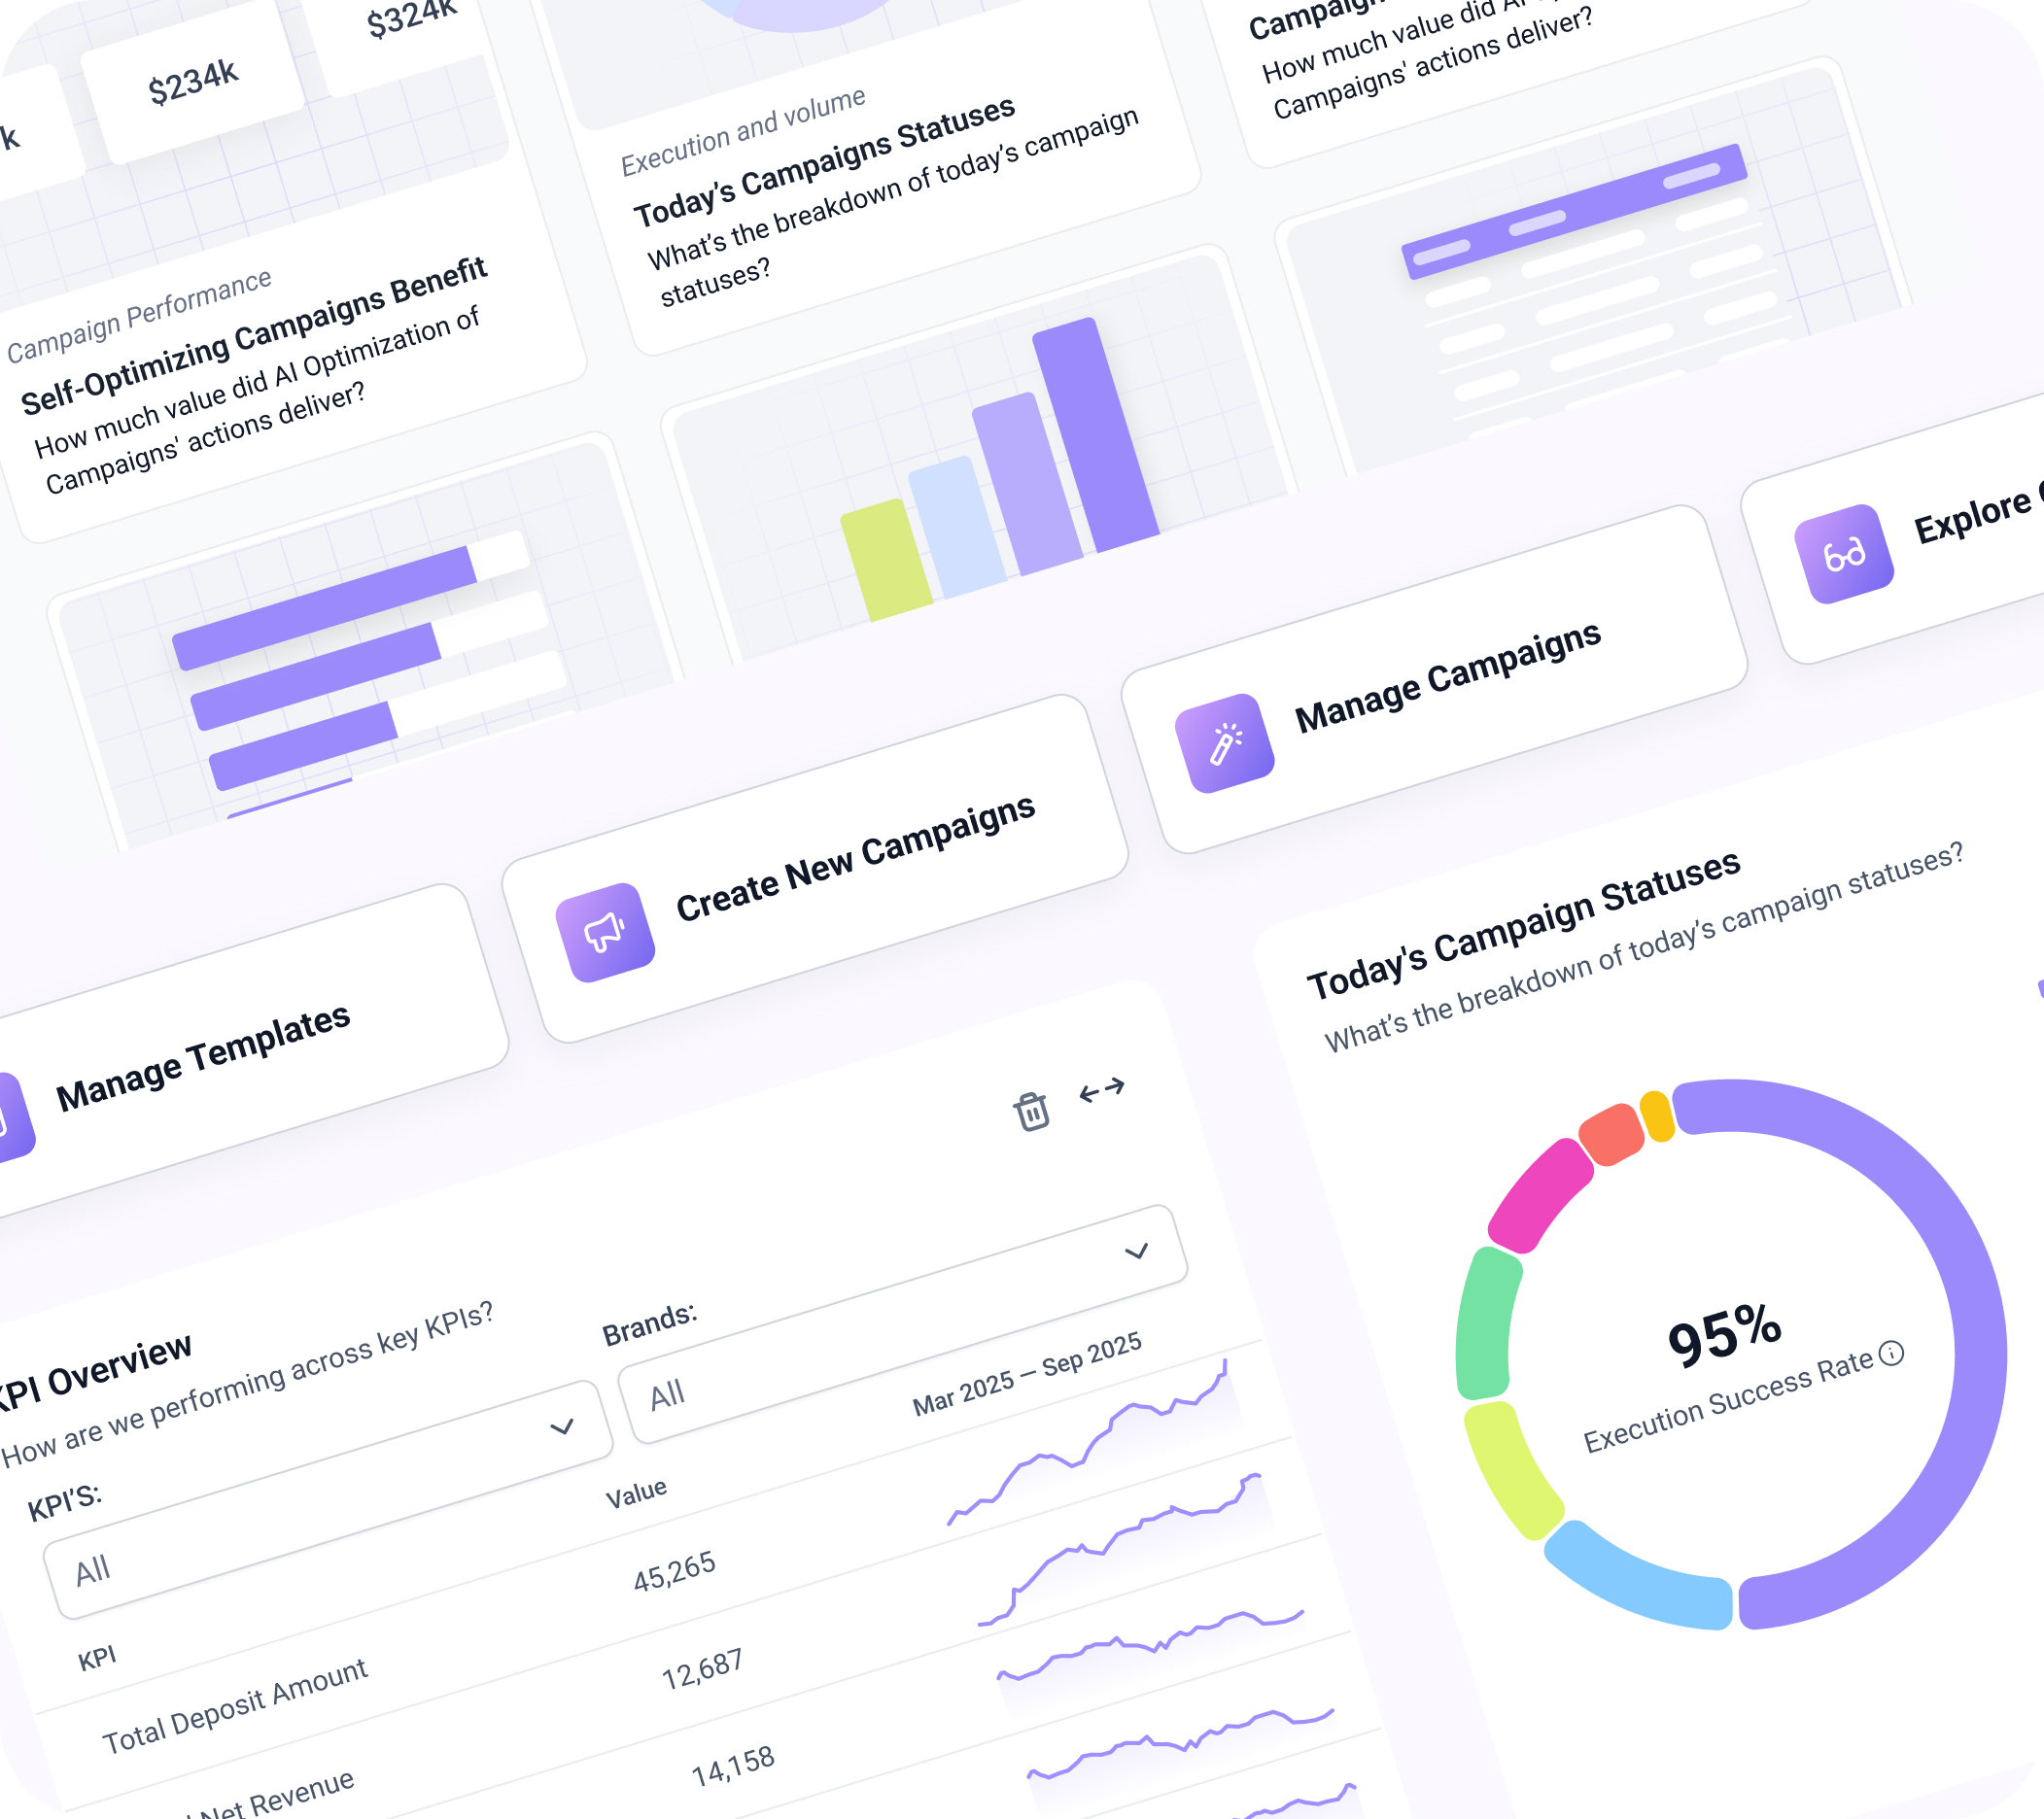
Vibe Coding Dashboard | 2026
Redesigned a modular dashboard and widget center, leveraging Vibe Coding with Claude Code to rapidly transform high-level design concepts into a fully functional frontend.
View Project
New Installs by Groups
Control Group
Group A
Group B
Group C
0
50
100
150
200
Num. New Installs
113
New Installs Over Time
0
50
100
150
200
250
300
350
400
01.01
05.01
10.01
15.01
20.01
25.01
30.01
Retention
Control Group
Group A
Group B
Group C
07
dormant PU
dormant PU
3.45%
3.45%
Groups
Average
Lift
Number of Players
Absolute Change
group A VS. Control
29.75%
234,212
2.5%
1300
group B VS. Control
42.15% (40,222)
234,212
2.5%
1034
group C VS. Control
25.32% (45,323)
234,212
2.5%
734
06
cristian inapp september 8
+
45
-
14
06
new players
-
112
+
328
250%
200%
150%
100%
50%
10%
01.01
05.01
10.01
15.01
20.01
25.01
30.01
Retention
07.01
Group C
83%
Group B
65%
Control Group
56%
Group A
55%
Total New Installs (All groups)
20, 000
Lucy_Cards_2023
Stop
Finished
FL
aB testing
P
v 1.2.0
Summary
analysis
Summary
analysis
Date Range:
Last 7 Days
Group A vs. Control
Lift
Increase
CI Lift
Group B vs. Control
Lift
Increase
CI Lift
Group D vs. Control
Lift
Increase
CI Lift
Metrics
Metric
Gross Revenue
Goal Metric
Retention Day 1
Retention Day 7
Retention Day 14
Retention Day 30
Conversion Day 1
Conversion Day 7
Conversion Day 14
Conversion Day 30
ARPI Day 1
ARPI Day 7
ARPI Day 14
ARPI Day 30
+5.77%
+5.77%
-3.45%
+5.77%
+4.54%
-4.54%
-$1K
-$966
-1.74%
+4.54%
-$989.27
-263.11%
-263.11%
-263.11%
+2.33%
+16.08%
+16.08%
+16.08%
+23.32%
+2.23%
+$0.39
-$-0.0
+$0.1
-1.23%
+16.08%
+16.08%
+16.08%
+2.23%
-1.23%
+$0.39
-$-0.0
+$0.1
-1.67%
+16.08%
+16.08%
+16.08%
-1.23%
+12.5%
+$0.39
-$-0.0
+$0.1
+12.5%
-$1K
-$966
-1.74%
-1.74%
-$989.27
-263.11%
-263.11%
-263.11%
+4.54%
+16.08%
+16.08%
+16.08%
-1.74%
-1.74%
+$0.39
-$-0.0
+$0.1
+2.43%
+16.08%
+16.08%
+16.08%
-1.74%
+2.23%
+$0.39
-$-0.0
+$0.1
+5.45%
+16.08%
+16.08%
+16.08%
-1.74%
+4.54%
+$0.39
-$-0.0
+$0.1
+2.23%
-$1K
-$966
-$1K
-$966
-$1K
-$966
-$1K
-$966
+5.45%
-1.74%
-$989.27
-263.11%
-263.11%
-263.11%
-4.53%
-$-0.0
+$0.1
-$1K
-$966
-$-0.0
+$0.1
+16.08%
+16.08%
+16.08%
+5.45%
+2.23%
+$0.39
-$-0.0
+$0.1
-2.22%
-$-0.0
+$0.1
-$1K
-$966
-$-0.0
+$0.1
+16.08%
+16.08%
+16.08%
+5.45%
+12.5%
+$0.39
-$-0.0
+$0.1
+2.35%
-$-0.0
+$0.1
-$-0.0
+$0.1
+$0.02
+$0.89
+16.08%
+16.08%
+16.08%
+5.45%
+12.5%
+$0.39
-$-0.0
+$0.1
+1.22%

Recommendations
Lorem ipsum dolor sit amet, consectetur adipiscing elit. Morbi sed pharetra massa. Aenean iaculis molestie fringilla. Vivamus id tortor eget mauris tincidunt vestibulum ut a lacus. Vivamus eget efficitur urna, a vehicula magna. Duis eu lectus sed eros faucibus gravida vel non urna. Aliquam in aliquam ipsum. Praesent vitae.
Table Settings
Metric:
Cohort Metrics
Slicer
Choose Slicer
Groups
Group a vs. Control
Group B vs. Control
Group C vs. Control
Range
0.02$-2.22$
Lucy_Cards_2023
Stop
Finished
FL
aB testing
P
v 1.2.0
Summary
analysis
Filter
Last update
5 min ago
AB Testing | 2025
A/B testing optimizes game features via controlled experiments. While previous new installs test required external tools for, we designed a dedicated results page to centralize data and streamline the testing process.
View Project
New Installs by Groups
Control Group
Group A
Group B
Group C
0
50
100
150
200
Num. New Installs
113
New Installs Over Time
0
50
100
150
200
250
300
350
400
01.01
05.01
10.01
15.01
20.01
25.01
30.01
Retention
Control Group
Group A
Group B
Group C
07
dormant PU
dormant PU
3.45%
3.45%
Groups
Average
Lift
Number of Players
Absolute Change
group A VS. Control
29.75%
234,212
2.5%
1300
group B VS. Control
42.15% (40,222)
234,212
2.5%
1034
group C VS. Control
25.32% (45,323)
234,212
2.5%
734
06
cristian inapp september 8
+
45
-
14
06
new players
-
112
+
328
250%
200%
150%
100%
50%
10%
01.01
05.01
10.01
15.01
20.01
25.01
30.01
Retention
07.01
Group C
83%
Group B
65%
Control Group
56%
Group A
55%
Total New Installs (All groups)
20, 000
Lucy_Cards_2023
Stop
Finished
FL
aB testing
P
v 1.2.0
Summary
analysis
Summary
analysis
Date Range:
Last 7 Days
Group A vs. Control
Lift
Increase
CI Lift
Group B vs. Control
Lift
Increase
CI Lift
Group D vs. Control
Lift
Increase
CI Lift
Metrics
Metric
Gross Revenue
Goal Metric
Retention Day 1
Retention Day 7
Retention Day 14
Retention Day 30
Conversion Day 1
Conversion Day 7
Conversion Day 14
Conversion Day 30
ARPI Day 1
ARPI Day 7
ARPI Day 14
ARPI Day 30
+5.77%
+5.77%
-3.45%
+5.77%
+4.54%
-4.54%
-$1K
-$966
-1.74%
+4.54%
-$989.27
-263.11%
-263.11%
-263.11%
+2.33%
+16.08%
+16.08%
+16.08%
+23.32%
+2.23%
+$0.39
-$-0.0
+$0.1
-1.23%
+16.08%
+16.08%
+16.08%
+2.23%
-1.23%
+$0.39
-$-0.0
+$0.1
-1.67%
+16.08%
+16.08%
+16.08%
-1.23%
+12.5%
+$0.39
-$-0.0
+$0.1
+12.5%
-$1K
-$966
-1.74%
-1.74%
-$989.27
-263.11%
-263.11%
-263.11%
+4.54%
+16.08%
+16.08%
+16.08%
-1.74%
-1.74%
+$0.39
-$-0.0
+$0.1
+2.43%
+16.08%
+16.08%
+16.08%
-1.74%
+2.23%
+$0.39
-$-0.0
+$0.1
+5.45%
+16.08%
+16.08%
+16.08%
-1.74%
+4.54%
+$0.39
-$-0.0
+$0.1
+2.23%
-$1K
-$966
-$1K
-$966
-$1K
-$966
-$1K
-$966
+5.45%
-1.74%
-$989.27
-263.11%
-263.11%
-263.11%
-4.53%
-$-0.0
+$0.1
-$1K
-$966
-$-0.0
+$0.1
+16.08%
+16.08%
+16.08%
+5.45%
+2.23%
+$0.39
-$-0.0
+$0.1
-2.22%
-$-0.0
+$0.1
-$1K
-$966
-$-0.0
+$0.1
+16.08%
+16.08%
+16.08%
+5.45%
+12.5%
+$0.39
-$-0.0
+$0.1
+2.35%
-$-0.0
+$0.1
-$-0.0
+$0.1
+$0.02
+$0.89
+16.08%
+16.08%
+16.08%
+5.45%
+12.5%
+$0.39
-$-0.0
+$0.1
+1.22%
Recommendations
Lorem ipsum dolor sit amet, consectetur adipiscing elit. Morbi sed pharetra massa. Aenean iaculis molestie fringilla. Vivamus id tortor eget mauris tincidunt vestibulum ut a lacus. Vivamus eget efficitur urna, a vehicula magna. Duis eu lectus sed eros faucibus gravida vel non urna. Aliquam in aliquam ipsum. Praesent vitae.
Table Settings
Metric:
Cohort Metrics
Slicer
Choose Slicer
Groups
Group a vs. Control
Group B vs. Control
Group C vs. Control
Range
0.02$-2.22$
Lucy_Cards_2023
Stop
Finished
FL
aB testing
P
v 1.2.0
Summary
analysis
Filter
Last update
5 min ago
Campaign Tool 2.0 | 2025
Campaign Tool 2.0 streamlines in-game offer creation and multi-persona collaboration. The goal was to redesign the tool with a streamlined user flow and updated interface.
View Project
New Installs by Groups
Control Group
Group A
Group B
Group C
0
50
100
150
200
Num. New Installs
113
New Installs Over Time
0
50
100
150
200
250
300
350
400
01.01
05.01
10.01
15.01
20.01
25.01
30.01
Retention
Control Group
Group A
Group B
Group C
07
dormant PU
dormant PU
3.45%
3.45%
Groups
Average
Lift
Number of Players
Absolute Change
group A VS. Control
29.75%
234,212
2.5%
1300
group B VS. Control
42.15% (40,222)
234,212
2.5%
1034
group C VS. Control
25.32% (45,323)
234,212
2.5%
734
06
cristian inapp september 8
+
45
-
14
06
new players
-
112
+
328
250%
200%
150%
100%
50%
10%
01.01
05.01
10.01
15.01
20.01
25.01
30.01
Retention
07.01
Group C
83%
Group B
65%
Control Group
56%
Group A
55%
Total New Installs (All groups)
20, 000
Lucy_Cards_2023
Stop
Finished
FL
aB testing
P
v 1.2.0
Summary
analysis
Summary
analysis
Date Range:
Last 7 Days
Group A vs. Control
Lift
Increase
CI Lift
Group B vs. Control
Lift
Increase
CI Lift
Group D vs. Control
Lift
Increase
CI Lift
Metrics
Metric
Gross Revenue
Goal Metric
Retention Day 1
Retention Day 7
Retention Day 14
Retention Day 30
Conversion Day 1
Conversion Day 7
Conversion Day 14
Conversion Day 30
ARPI Day 1
ARPI Day 7
ARPI Day 14
ARPI Day 30
+5.77%
+5.77%
-3.45%
+5.77%
+4.54%
-4.54%
-$1K
-$966
-1.74%
+4.54%
-$989.27
-263.11%
-263.11%
-263.11%
+2.33%
+16.08%
+16.08%
+16.08%
+23.32%
+2.23%
+$0.39
-$-0.0
+$0.1
-1.23%
+16.08%
+16.08%
+16.08%
+2.23%
-1.23%
+$0.39
-$-0.0
+$0.1
-1.67%
+16.08%
+16.08%
+16.08%
-1.23%
+12.5%
+$0.39
-$-0.0
+$0.1
+12.5%
-$1K
-$966
-1.74%
-1.74%
-$989.27
-263.11%
-263.11%
-263.11%
+4.54%
+16.08%
+16.08%
+16.08%
-1.74%
-1.74%
+$0.39
-$-0.0
+$0.1
+2.43%
+16.08%
+16.08%
+16.08%
-1.74%
+2.23%
+$0.39
-$-0.0
+$0.1
+5.45%
+16.08%
+16.08%
+16.08%
-1.74%
+4.54%
+$0.39
-$-0.0
+$0.1
+2.23%
-$1K
-$966
-$1K
-$966
-$1K
-$966
-$1K
-$966
+5.45%
-1.74%
-$989.27
-263.11%
-263.11%
-263.11%
-4.53%
-$-0.0
+$0.1
-$1K
-$966
-$-0.0
+$0.1
+16.08%
+16.08%
+16.08%
+5.45%
+2.23%
+$0.39
-$-0.0
+$0.1
-2.22%
-$-0.0
+$0.1
-$1K
-$966
-$-0.0
+$0.1
+16.08%
+16.08%
+16.08%
+5.45%
+12.5%
+$0.39
-$-0.0
+$0.1
+2.35%
-$-0.0
+$0.1
-$-0.0
+$0.1
+$0.02
+$0.89
+16.08%
+16.08%
+16.08%
+5.45%
+12.5%
+$0.39
-$-0.0
+$0.1
+1.22%
Recommendations
Lorem ipsum dolor sit amet, consectetur adipiscing elit. Morbi sed pharetra massa. Aenean iaculis molestie fringilla. Vivamus id tortor eget mauris tincidunt vestibulum ut a lacus. Vivamus eget efficitur urna, a vehicula magna. Duis eu lectus sed eros faucibus gravida vel non urna. Aliquam in aliquam ipsum. Praesent vitae.
Table Settings
Metric:
Cohort Metrics
Slicer
Choose Slicer
Groups
Group a vs. Control
Group B vs. Control
Group C vs. Control
Range
0.02$-2.22$
Lucy_Cards_2023
Stop
Finished
FL
aB testing
P
v 1.2.0
Summary
analysis
Filter
Last update
5 min ago
Detector | 2025
Coming soon
© 2026 by Adi Barkan Maor